Legally India has crunched the numbers in the first merit list into a table that will tell you which states performed best at the Common Law Admission Test (CLAT).
Where is the CLAT most popular?
The largest number of applicants came from India’s most populous state, Uttar Pradesh, from where 7981 applied for the exam.
Rajasthan, Madhra Pradesh and Delhi each sent between 3,000 and 4,000 candidates each.
However, several states are over-represented considerably when it comes to the proportion of their population that apply for the CLAT.
In Chandigarh, for every 1 million of population, 270 sat for the CLAT.
In Delhi, 200 out of 1 million inhabitants sat for the CLAT.
After the two city states, Haryana, Uttarakhand, Rajasthan, Madhya Pradesh and Punjab are all around the 50 candidates or more per 1 million mark.
Himachal Pradesh, Uttar Pradesh and Chhattisgarh all send less than 50m per capita, which is still above the national average though.
States such as Karnataka and Maharashtra sent fewer candidates per capita than the national average.
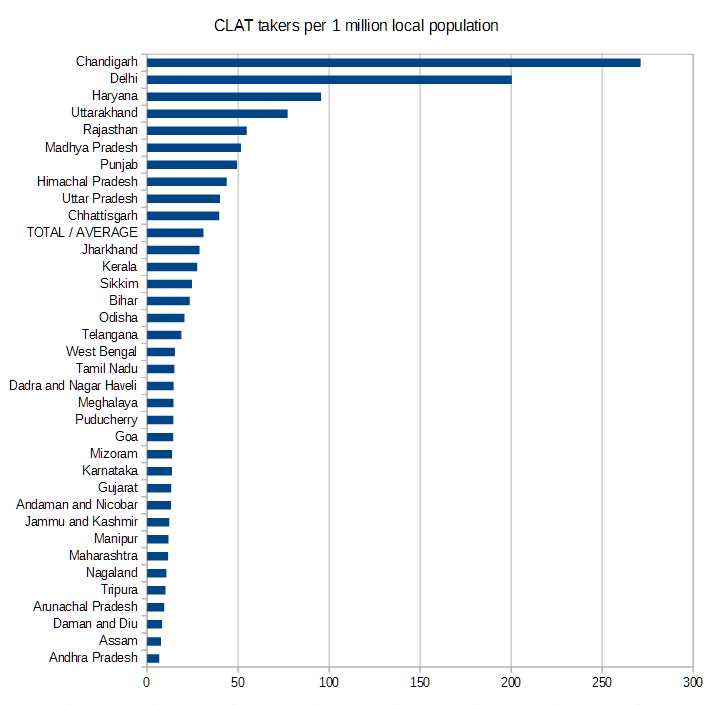
CLAT performance per capita
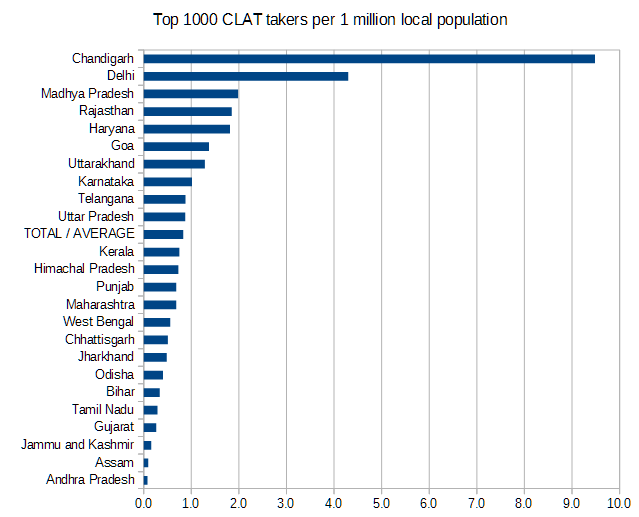
Evaluating only the top 1000 rankers in the CLAT per 1 million of local population, does not paint a drastically different picture, although a few states perform better than their population would suggest here.
Karnataka, for instance, has a disproportionate number of top 1000-ranked CLAT candidates and is above the national average now, despite having sent fewer candidates per capita than many other states.
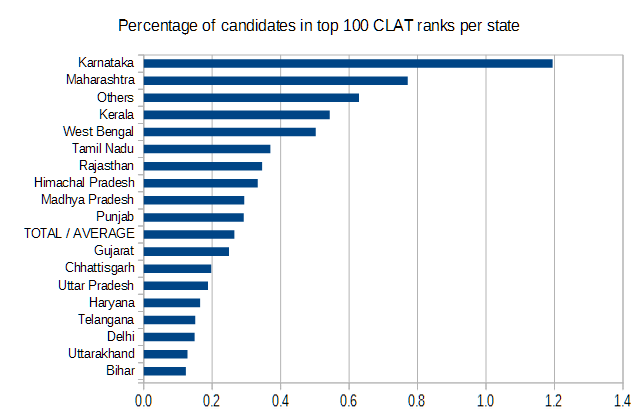
CLAT performance per state vs total candidates sent: Top 100 ranks
The relative performance of CLAT applicants compared to how many candidates came from each state, paints a different picture than the previous charts.
Karnataka performs better than all others, with 1.2% of its CLAT candidates getting into the top 100.
This is closely followed by Maharashtra, where 0.8% of CLAT candidates made it to the top 100.
The ‘others’ category, which presumably includes non-resident Indians, scored just above Kerala and West Bengal.
Less than 0.4% of candidates from Tamil Nadu, Rajasthan, Madhya Pradesh and Punjab made it into the top 100 ranks.
Gujarat, Chhattisgarh, Uttar Pradesh, Haryana, Telangana, Delhi, Uttarakhand and Bihar all perform below the national average.
A number of smaller states, including Chandigarh which supplied the highest number of candidates per capita, did not get any students into the top 100 ranks.
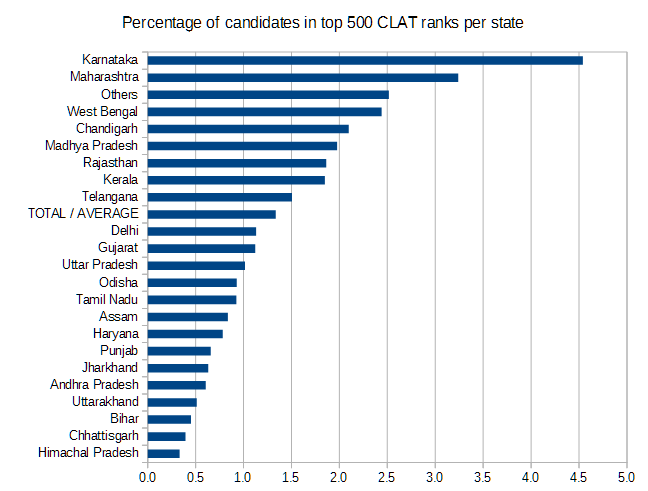
CLAT performance vs total candidates sent: Top 500 ranks
The picture is mostly replicated in the top 500 ranks, though Chandigarh appears in fifth place in the rankings of top-500-ranked candidates as a percentage of total candidates sent to the CLAT by the state.
Karnataka and Maharashtra again perform best in this metric, alongside West Bengal and Madhya Pradesh, Rajasthan, Kerala and Telangana.
Delhi, Gujarat, Uttar Pradesh and Odisha again perform below average, getting fewer candidates into the top 500 ranks per CLAT applicant than the national average.
Bihar, Chhattisgarh and Himachal Pradesh perform the worst.
Also read
- CLAT: A filter that needs replacing [via Mint] #longread
- CLAT 2015: Why did girls do MUCH worse than boys this year? [Via Mint: Download full source #data]
- State-by-state CLAT 2015 performance: 4 charts prove Karnataka is king of CLAT, while UP, Bihar underperform
- Download full Excel sheet dataset of all 37,358 applicants and calculations for these and other stats in this series (Zipped PDF: 1.6MB)
All data (click table header to sort by each metric)
| Domicile | Total taken CLAT | Candidates ranked in top 100 | % in top 100 ranks out of all CLATers | Candidates ranked in top 500 | % in top 500 ranks out of all CLATers | Candidates ranked in top 1000 | % in top 1000 ranks out of all CLATers | CLAT takers / 1m population | Top 1000 CLATers per 1m population |
|---|---|---|---|---|---|---|---|---|---|
| Karnataka | 837 | 10 | 1.19 | 38 | 4.5 | 62 | 7.4 | 14 | 1.01 |
| Maharashtra | 1296 | 10 | .77 | 42 | 3.2 | 77 | 5.9 | 12 | .69 |
| Others | 159 | 1 | .63 | 4 | 2.5 | 14 | 8.8 | ||
| West Bengal | 1393 | 7 | .50 | 34 | 2.4 | 51 | 3.7 | 15 | .56 |
| Chandigarh | 286 | 0 | 0 | 6 | 2.1 | 10 | 3.5 | 271 | 9.48 |
| Madhya Pradesh | 3745 | 11 | .29 | 74 | 2.0 | 144 | 3.8 | 52 | 1.98 |
| Rajasthan | 3757 | 13 | .35 | 70 | 1.9 | 127 | 3.4 | 55 | 1.85 |
| Kerala | 920 | 5 | .54 | 17 | 1.8 | 25 | 2.7 | 28 | .75 |
| Telangana | 664 | 1 | .15 | 10 | 1.5 | 31 | 4.7 | 19 | .88 |
| TOTAL / AVERAGE | 37358 | 100 | .27 | 500 | 1.3 | 1000 | 2.7 | 31 | .83 |
| Delhi | 3358 | 5 | .15 | 38 | 1.1 | 72 | 2.1 | 200 | 4.30 |
| Gujarat | 802 | 2 | .25 | 9 | 1.1 | 16 | 2.0 | 13 | .26 |
| Uttar Pradesh | 7981 | 15 | .19 | 81 | 1.0 | 174 | 2.2 | 40 | .87 |
| Odisha | 861 | 0 | 0 | 8 | .9 | 17 | 2.0 | 21 | .41 |
| Tamil Nadu | 1081 | 4 | .37 | 10 | .9 | 21 | 1.9 | 15 | .29 |
| Assam | 239 | 0 | 0 | 2 | .8 | 3 | 1.3 | 8 | .10 |
| Haryana | 2425 | 4 | .16 | 19 | .8 | 46 | 1.9 | 96 | 1.81 |
| Punjab | 1368 | 4 | .29 | 9 | .7 | 19 | 1.4 | 49 | .69 |
| Jharkhand | 950 | 0 | 0 | 6 | .6 | 16 | 1.7 | 29 | .49 |
| Andhra Pradesh | 330 | 0 | 0 | 2 | .6 | 4 | 1.2 | 7 | .08 |
| Uttarakhand | 781 | 1 | .13 | 4 | .5 | 13 | 1.7 | 77 | 1.28 |
| Bihar | 2432 | 3 | .12 | 11 | .5 | 35 | 1.4 | 23 | .34 |
| Chhattisgarh | 1013 | 2 | .20 | 4 | .4 | 13 | 1.3 | 40 | .51 |
| Himachal Pradesh | 300 | 1 | .33 | 1 | .3 | 5 | 1.7 | 44 | .73 |
| Andaman and Nicobar | 5 | 0 | 0 | 0 | 0 | 0 | 0 | 13 | 0 |
| Arunachal Pradesh | 13 | 0 | 0 | 0 | .0 | 0 | 0 | 9 | 0 |
| Dadra and Nagar Haveli | 5 | 0 | 0 | 0 | 0 | 0 | 0 | 15 | 0 |
| Daman and Diu | 2 | 0 | 0 | 0 | 0 | 0 | 0 | 8 | 0 |
| Goa | 21 | 0 | 0 | 0 | .0 | 2 | 9.5 | 14 | 1.37 |
| Jammu and Kashmir | 153 | 0 | 0 | 0 | .0 | 2 | 1.3 | 12 | .16 |
| Manipur | 32 | 0 | 0 | 0 | .0 | 0 | 0 | 12 | 0 |
| Meghalaya | 43 | 0 | 0 | 0 | .0 | 0 | 0 | 15 | 0 |
| Mizoram | 15 | 0 | 0 | 0 | .0 | 0 | 0 | 14 | 0 |
| Nagaland | 21 | 0 | 0 | 0 | .0 | 0 | 0 | 11 | 0 |
| Puducherry | 18 | 0 | 0 | 0 | .0 | 0 | 0 | 14 | 0 |
| Sikkim | 15 | 0 | 0 | 0 | 0 | 0 | 0 | 25 | 0 |
| Tripura | 37 | 0 | 0 | 0 | .0 | 0 | 0 | 10 | 0 |
Source: Legally India research / CLAT 2015 first merit list / 2011 census data
Comments
wtf!!!
THOUGH FEW PEOPLE SAT FOR CLAT
Hint: UP had the highest number of candidates. go figure.
[till the first 5 digit rank]
Sikkim 10007
Mizoram 3960 12819
Manipur 8202 8990 12564
Nagaland 5080 5893 9236 9773 10124
Tripura 5346 6552 7904 8500 8711 12199
Meghalaya 6399 6694 9407 10950
Assam 289 299 586 1360 1925 2073 2078 2174 2192 2933 3363 3480 3526 4357 4665 4886 5003 5020 ~~~[too many]
Arunachal Pradesh 10475
As always, among the North East States, Assam has excelled with more than 10 under 10000; save for Assam, the Rank would be with Mizoram with the highest, followed by Nagaland, Tripura, Meghalaya, Manipur, Sikkim and A.P.
While you may be correct in the statement that one year's result as a sample does not give a balanced or conclusive result, this article doesn't claim to be one.
Using the 'For All We Know...' argument would be wrong, since if you claim [assuming you are only talking about the North-East States] that Sikkim would have done better the other states, what is your argument against the stance that the other states, say Manipur or A.P. would've been/done better than Assam or Mizoram or say, Sikkim for that matter?
It's a lot of work crunching the numbers but the outcomes are quite interesting.
Would love to see and cover some deeper academic analysis with these kind of issues also.